A landing page for the resources to help you thrive.

Mental Health and Substance Abuse Interactive Map
Click the >> in the top left corner to toggle on and off layers to see the Mental Health and Substance Abuse impact across the state of Tennessee.
Legend:
- 1-1.99 = Problematic – areas with large circles indicate areas with poorest mental health or greatest rates of problematic substance use among residents
- 2 – 2.99 = Fair – areas with medium circles indicate areas with fair mental health or moderate rates of problematic substance use among residents
- 3 = Optimal – areas with smallest circles indicate areas with optimal mental health or smallest rates problematic substance use among residents
*Size of the circle = size of the problem

Mental Health
Learn About Mental Health
- My Mental Health Fact Sheet
- Mindfulness for School Age Children (UT Extension)
- Identifying Teen Mental Health Difficulties (UT Extension)
- Anxiety in Children & Youth (UT Extension)
- Tips for Adult and Child Mental Well-Being (UT Extension)
- Behavioral Health FAQ Sheet (UT Extension)
- Tips for Mental Health
Screening Tools
- Behavioral Health Symptom Checker (Child Mind Institute)
- How Trauma Affects Kids in School (Child Mind Institute)
- Anxiety Screening Tool
- Depression Screening Tool
- Youth Screening Tool for Parents

Find Programs and Therapeutic Resources
- Click for information on the Employee Assistance Program for UT Personnel or call 855-437-3486
- Find a Support Group or Local Program for Mental Health or Substance Use (SAMHSA)
- Find Online Mental Health Services (UT Extension)
- Fast Facts: TDMHSAS Licensed Sites
- Mental Health First Aid – Contact your local County FCS or 4-H Agent to learn about accessing the awareness training or contact kconrad4@utk.edu for more information
- QPR “Question Persuade Refer” Suicide Prevention Training

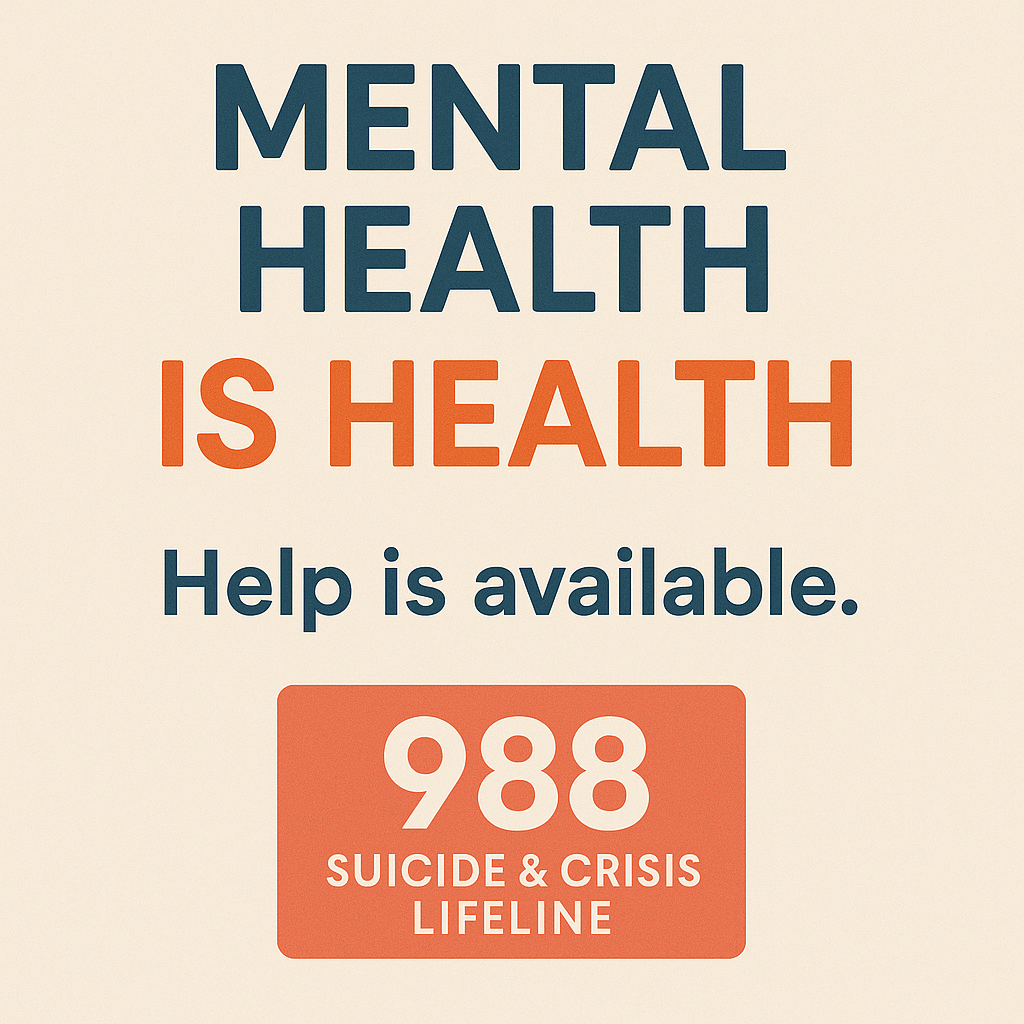
Emergency Helplines
In crisis? Call or Text 988, Suicide Crisis Lifeline to TALK TO SOMEONE NOW or visit the resource links below.
-
Tennesseans Together for Mental Health (TT4MH) Celebrating Mental Health Awareness Month!
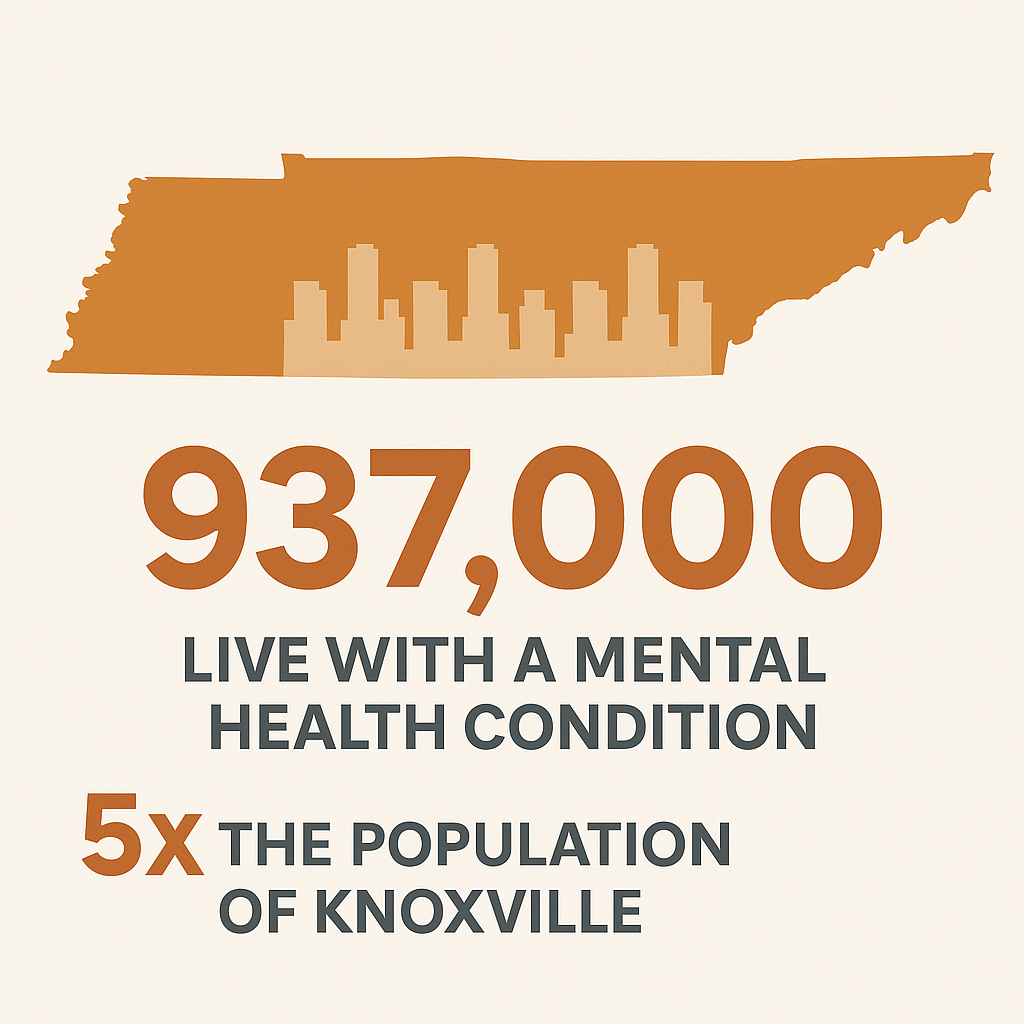
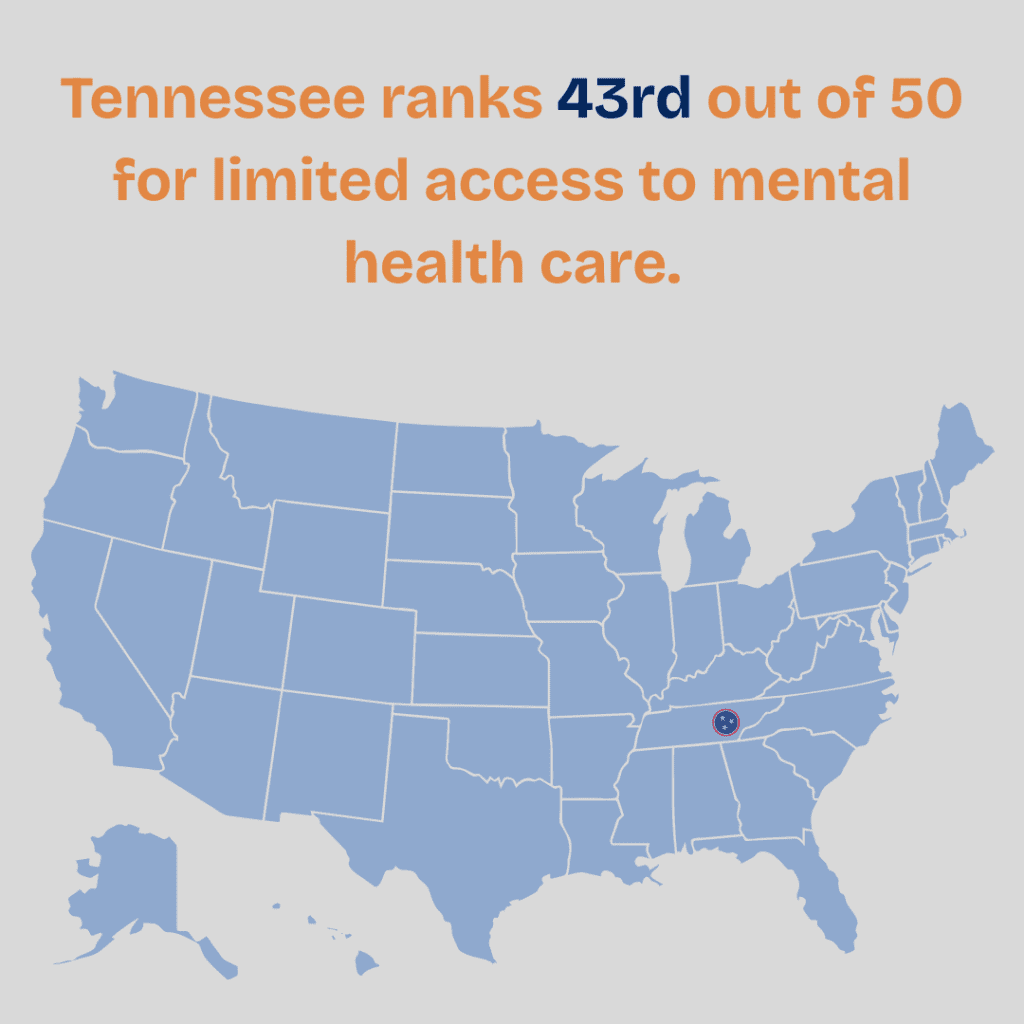
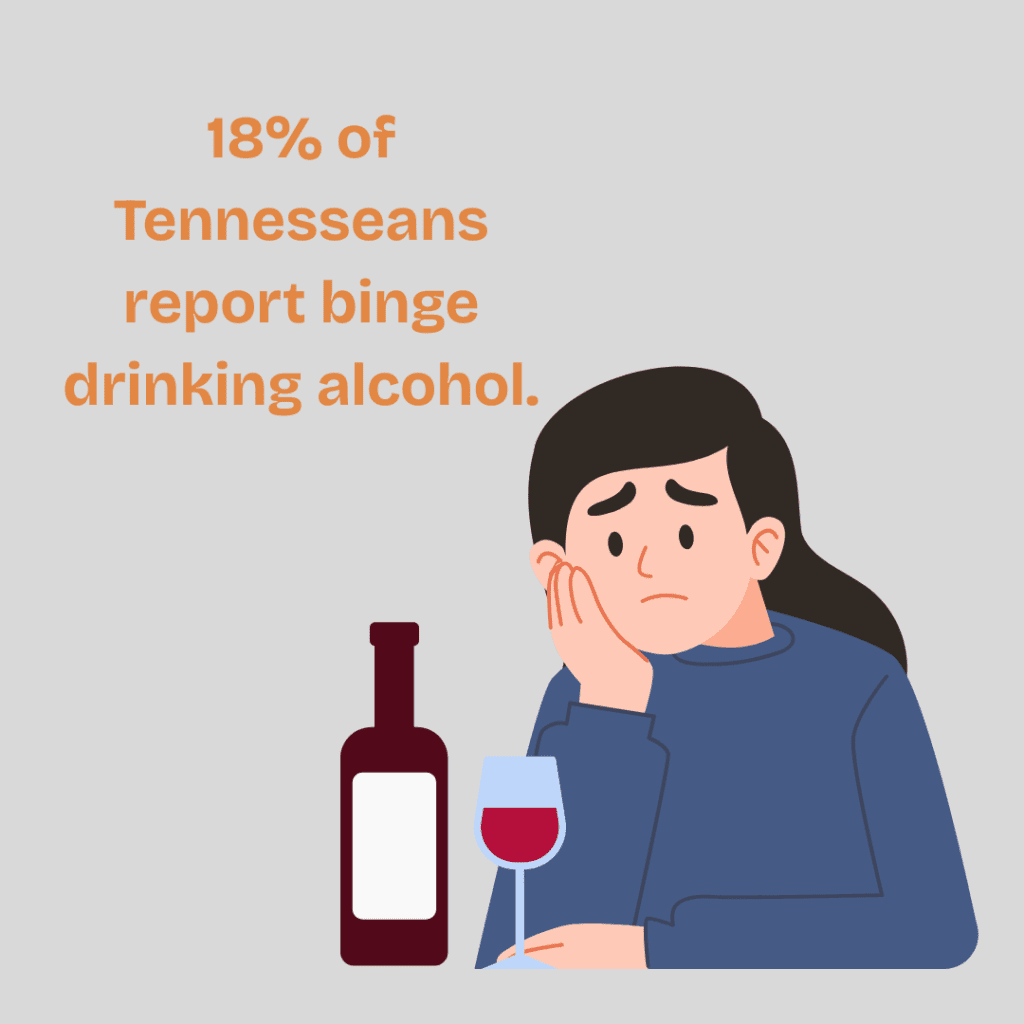
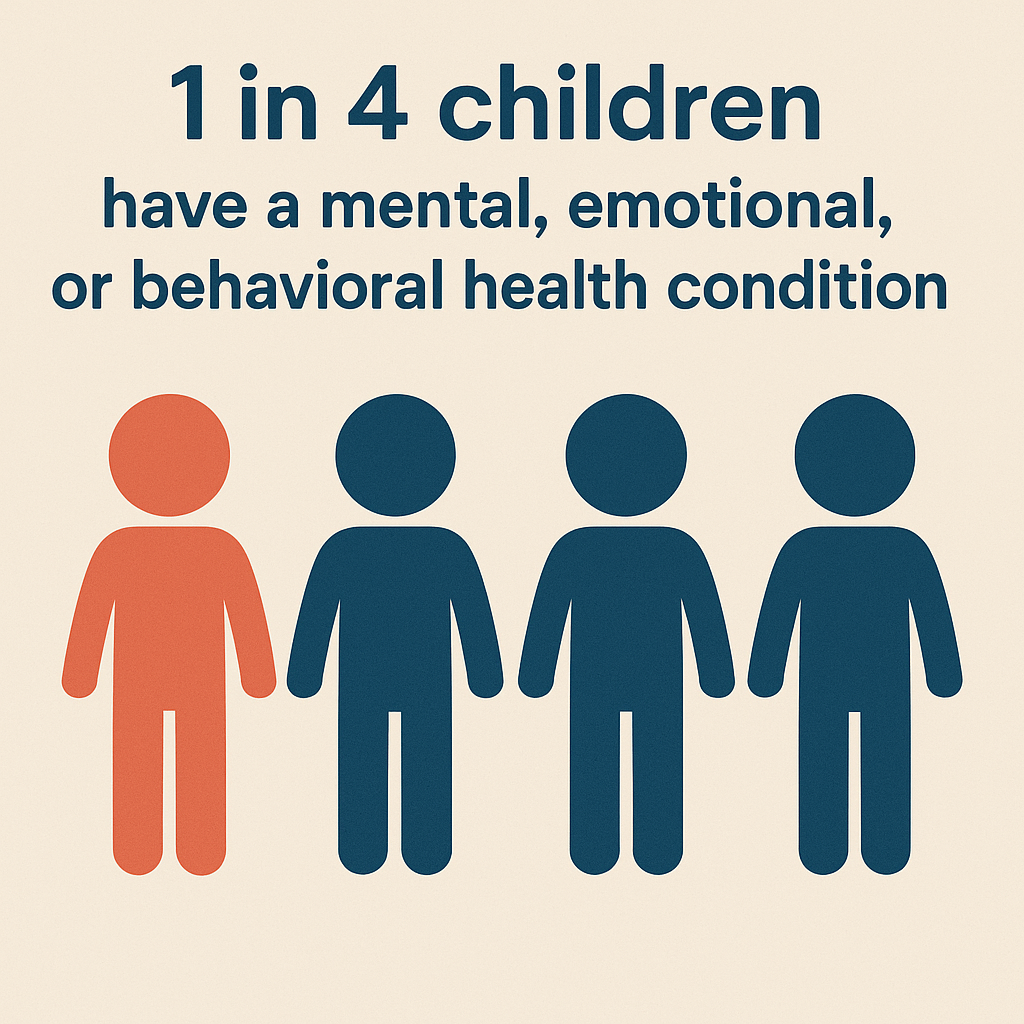
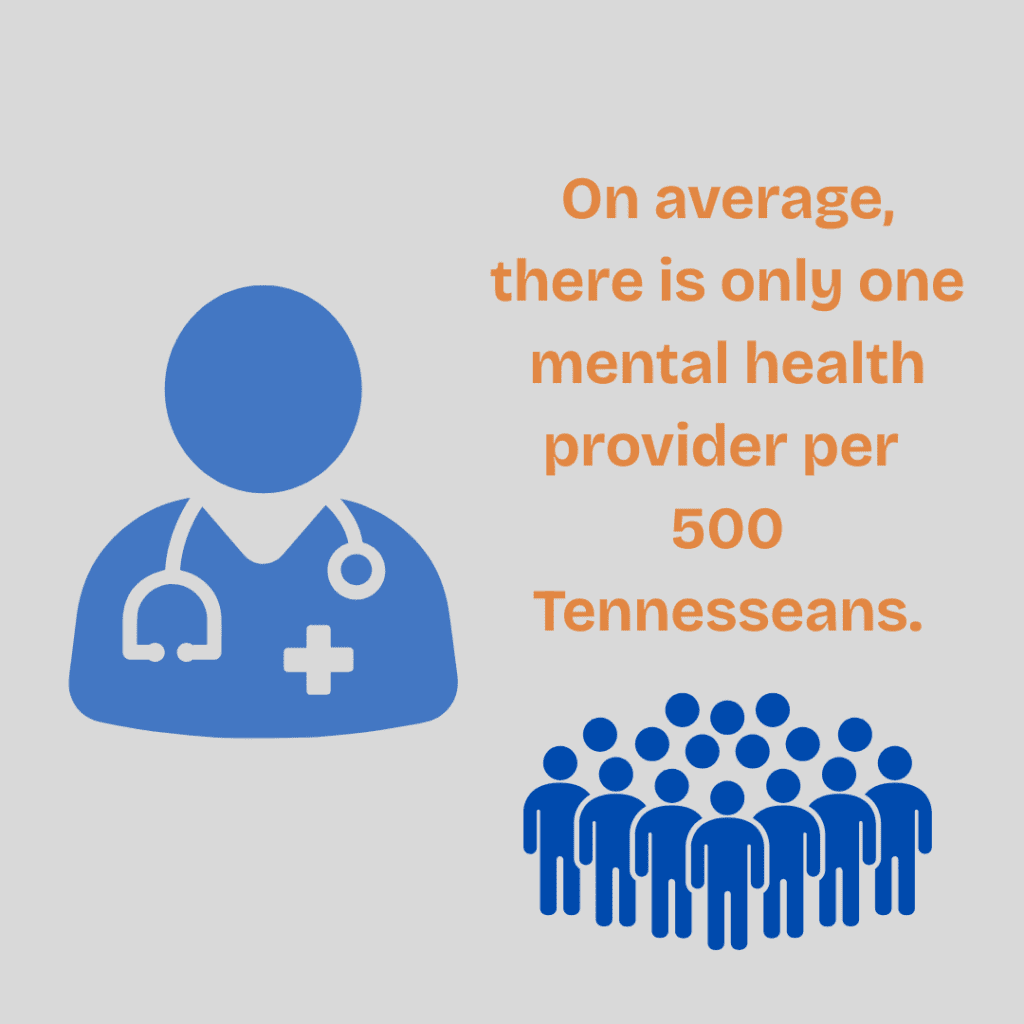
May is Mental Health Awareness Month. UT Extension recognizes the vital impact of mental health on physical well-being, relationships, and productivity. Raising mental health awareness.The statistics don’t lie. Tennessee ranks…